Direct Outcome Prediction Model#
Also known as standardization
%matplotlib inline
from sklearn.linear_model import LinearRegression
from sklearn.ensemble import GradientBoostingRegressor

from causallib.datasets import load_nhefs
from causallib.estimation import Standardization, StratifiedStandardization
from causallib.evaluation import evaluate
Data:#
The effect of smoking cessation on weight loss.
Data example is taken from Hernan and Robins Causal Inference Book
data = load_nhefs()
data.X.join(data.a).join(data.y).head()
| age | race | sex | smokeintensity | smokeyrs | wt71 | active_1 | active_2 | education_2 | education_3 | education_4 | education_5 | exercise_1 | exercise_2 | age^2 | wt71^2 | smokeintensity^2 | smokeyrs^2 | qsmk | wt82_71 | |
|---|---|---|---|---|---|---|---|---|---|---|---|---|---|---|---|---|---|---|---|---|
| 0 | 42 | 1 | 0 | 30 | 29 | 79.04 | 0 | 0 | 0 | 0 | 0 | 0 | 0 | 1 | 1764 | 6247.3216 | 900 | 841 | 0 | -10.093960 |
| 1 | 36 | 0 | 0 | 20 | 24 | 58.63 | 0 | 0 | 1 | 0 | 0 | 0 | 0 | 0 | 1296 | 3437.4769 | 400 | 576 | 0 | 2.604970 |
| 2 | 56 | 1 | 1 | 20 | 26 | 56.81 | 0 | 0 | 1 | 0 | 0 | 0 | 0 | 1 | 3136 | 3227.3761 | 400 | 676 | 0 | 9.414486 |
| 3 | 68 | 1 | 0 | 3 | 53 | 59.42 | 1 | 0 | 0 | 0 | 0 | 0 | 0 | 1 | 4624 | 3530.7364 | 9 | 2809 | 0 | 4.990117 |
| 4 | 40 | 0 | 0 | 20 | 19 | 87.09 | 1 | 0 | 1 | 0 | 0 | 0 | 1 | 0 | 1600 | 7584.6681 | 400 | 361 | 0 | 4.989251 |
“Standard” Standardization (S-Learner)#
A single model (the S in S-Learner) is trained with the treatment assignment as an additional feature.
During inference, the model assigns a single treatment value for all samples, thus predicting the potential outcome of all samples.
std = Standardization(LinearRegression())
std.fit(data.X, data.a, data.y)
Standardization(encode_treatment=False, predict_proba=False,
                learner=LinearRegression())
Outcome Prediction#
The model can be used to predict individual outcomes:
The potential outcome under each intervention (columns correspond to treatment values)
ind_outcomes = std.estimate_individual_outcome(data.X, data.a)
ind_outcomes.head()
| qsmk | 0 | 1 |
|---|---|---|
| 0 | 4.271756 | 7.734378 |
| 1 | 6.337239 | 9.799861 |
| 2 | 1.989807 | 5.452429 |
| 3 | -4.261624 | -0.799002 |
| 4 | 2.290883 | 5.753505 |
The model can be used to predict population outcomes,
By aggregating the individual outcome prediction (e.g., mean or median).
Providing agg_func which is defaulted to 'mean'
median_pop_outcomes = std.estimate_population_outcome(data.X, data.a, agg_func="median")
median_pop_outcomes.rename("median", inplace=True)

mean_pop_outcomes = std.estimate_population_outcome(data.X, data.a, agg_func="mean")
mean_pop_outcomes.rename("mean", inplace=True)

pop_outcomes = mean_pop_outcomes.to_frame().join(median_pop_outcomes)
pop_outcomes
| mean | median | |
|---|---|---|
| qsmk | ||
| 0 | 1.747216 | 2.391416 |
| 1 | 5.209838 | 5.854038 |
Effect Estimation#
Similarly, Effect estimation can be done on either individual or population level, depending on the outcomes provided.
Population level effect using population outcomes:
std.estimate_effect(mean_pop_outcomes[1], mean_pop_outcomes[0])
diff    3.462622
dtype: float64
Population level effect using individual outcome, but asking for aggregation (default behaviour):
std.estimate_effect(ind_outcomes[1], ind_outcomes[0], agg="population")
diff    3.462622
dtype: float64
Individual level effect using inidividual outcomes:
Since we’re using a binary treatment with linear regression on a standard model,
the difference is same for all individuals, and is equal to the coefficient of the treatment varaible.
This is usually refered to as homogenuous effect.
print(std.learner.coef_[0])
std.estimate_effect(ind_outcomes[1], ind_outcomes[0], agg="individual").head()
3.462621829225887
| effect_type | diff |
|---|---|
| 0 | 3.462622 |
| 1 | 3.462622 |
| 2 | 3.462622 |
| 3 | 3.462622 |
| 4 | 3.462622 |
Multiple types of effect are also supported:
std.estimate_effect(ind_outcomes[1], ind_outcomes[0],
                    agg="individual", effect_types=["diff", "ratio"]).head()
| effect_type | diff | ratio |
|---|---|---|
| 0 | 3.462622 | 1.810585 |
| 1 | 3.462622 | 1.546393 |
| 2 | 3.462622 | 2.740179 |
| 3 | 3.462622 | 0.187488 |
| 4 | 3.462622 | 2.511479 |
Treament one-hot encoded#
For multi-treatment cases, where treatments are coded as 0, 1, 2, … but have no ordinal interpretation,
It is possible to make the model encode the treatment assignment vector as one hot matrix.
std = Standardization(LinearRegression(), encode_treatment=True)
std.fit(data.X, data.a, data.y)
pop_outcomes = std.estimate_population_outcome(data.X, data.a, agg_func="mean")
std.estimate_effect(mean_pop_outcomes[1], mean_pop_outcomes[0])
diff    3.462622
dtype: float64
Stratified Standarziation (T-Learner)#
While standardization above can be viewed as a “complete pooled” estimator,
as it includes both treatment groups together,
Stratified Standardization can viewed as “complete unpooled” one,
as it completly stratifies the dataset by treatment values and learns a different model for each treatment group.
std = StratifiedStandardization(LinearRegression())
std.fit(data.X, data.a, data.y)
StratifiedStandardization(learner=LinearRegression())
Checking the core learner we can see that it actually has two models (the T in T-Learner), indexed by the treatment value:
std.learner
{0: LinearRegression(), 1: LinearRegression()}
We can apply same analysis as above.
pop_outcomes = std.estimate_population_outcome(data.X, data.a, agg_func="mean")
std.estimate_effect(mean_pop_outcomes[1], mean_pop_outcomes[0])
diff    3.462622
dtype: float64
While the average population-level effect is the same, the individual effect is now heterogenuous.
However, this flexibility in modelling does not come for free, since each model now uses less data and therefore has less statistical power.
ind_outcomes = std.estimate_individual_outcome(data.X, data.a)
std.estimate_effect(ind_outcomes[1], ind_outcomes[0], agg="individual").head()
| effect_type | diff |
|---|---|
| 0 | 3.389345 |
| 1 | 4.774150 |
| 2 | 7.653848 |
| 3 | 0.754123 |
| 4 | 6.769839 |
We can see that internally, when asking for some potential outcome,
the model simply applies the model trained on the group of that treatment:
potential_outcome = std.estimate_individual_outcome(data.X, data.a)[1]
direct_prediction =  std.learner[1].predict(data.X)
(potential_outcome == direct_prediction).all()
True
Providing complex scheme of learners#
When supplying a single learner to the standardization above,
the model simply duplicates it for each treatment value.
However, it is possible to specify a different model for each treatment value explicitly.
For example, in cases where the treated are more complex than the untreated
(because, say, background of those choosed to be treated),
it is possible to specify them with a more expressive model:
learner = {0: LinearRegression(),
           1: GradientBoostingRegressor()}
std = StratifiedStandardization(learner)
std.fit(data.X, data.a, data.y)
std.learner
{0: LinearRegression(), 1: GradientBoostingRegressor()}
ind_outcomes = std.estimate_individual_outcome(data.X, data.a)
ind_outcomes.head()
| qsmk | 0 | 1 |
|---|---|---|
| 0 | 4.174723 | 1.611459 |
| 1 | 5.715355 | 10.336035 |
| 2 | 1.069715 | 8.876902 |
| 3 | -3.004029 | -1.714927 |
| 4 | 1.303085 | 13.128340 |
std.estimate_effect(ind_outcomes[1], ind_outcomes[0])
diff    3.473088
dtype: float64
Evaluation#
Simple evaluation#
results = evaluate(std, data.X, data.a, data.y)
results.plot_all()
{'train': {'residuals': <AxesSubplot:title={'center':'Residual Plot'}, xlabel='Predicted values', ylabel='Prediction residuals'>,
  'continuous_accuracy': <AxesSubplot:title={'center':'Continuous Accuracy Plot'}, xlabel='Predicted values', ylabel='True values'>,
  'common_support': <AxesSubplot:title={'center':'Predicted Common Support'}, xlabel='Predicted $Y^0$', ylabel='Predicted $Y^1$'>}}
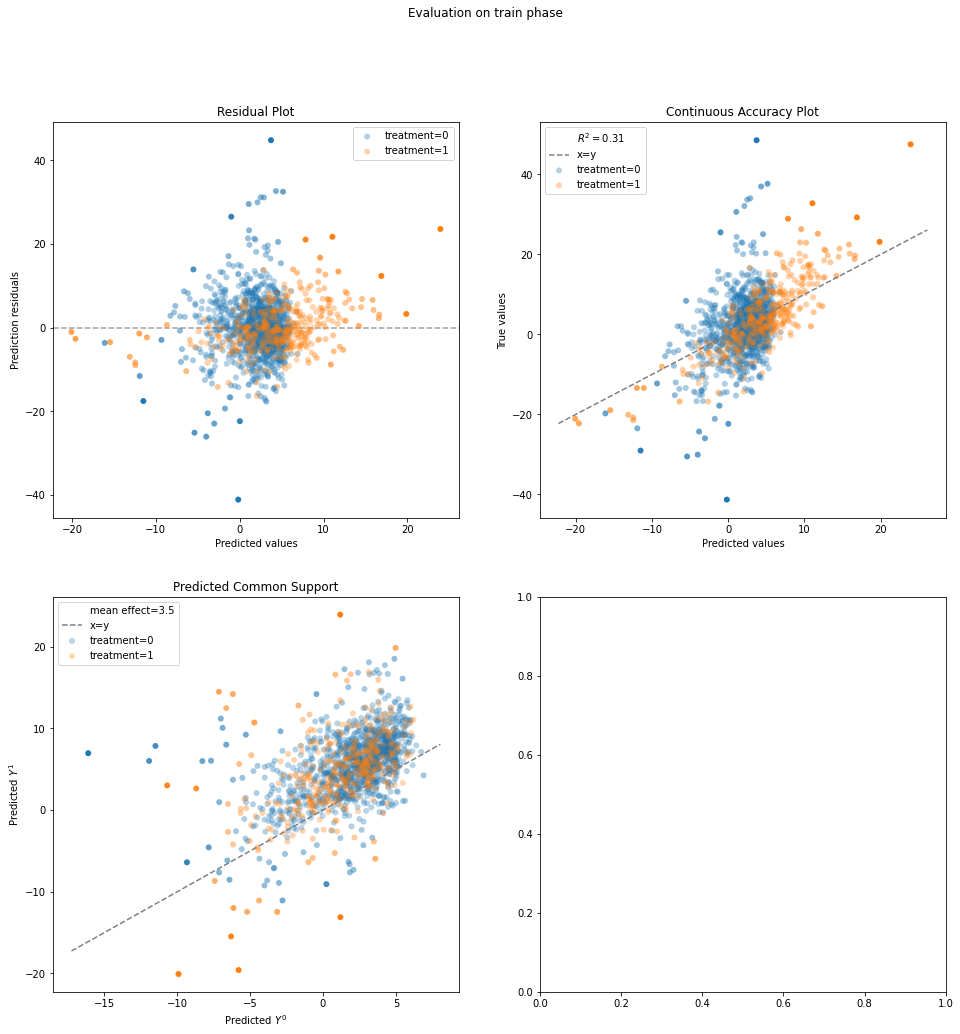
Results show the results for each treatment group separetly and also combined:
results.evaluated_metrics
| expvar | mae | mse | mdae | r2 | |
|---|---|---|---|---|---|
| model_strata | |||||
| actual | 0.305271 | 4.748815 | 43.110264 | 3.725702 | 0.305271 |
| 0 | 0.134184 | 4.984365 | 48.001726 | 3.892460 | 0.134184 |
| 1 | 0.620207 | 4.069050 | 28.994209 | 3.366938 | 0.620207 |
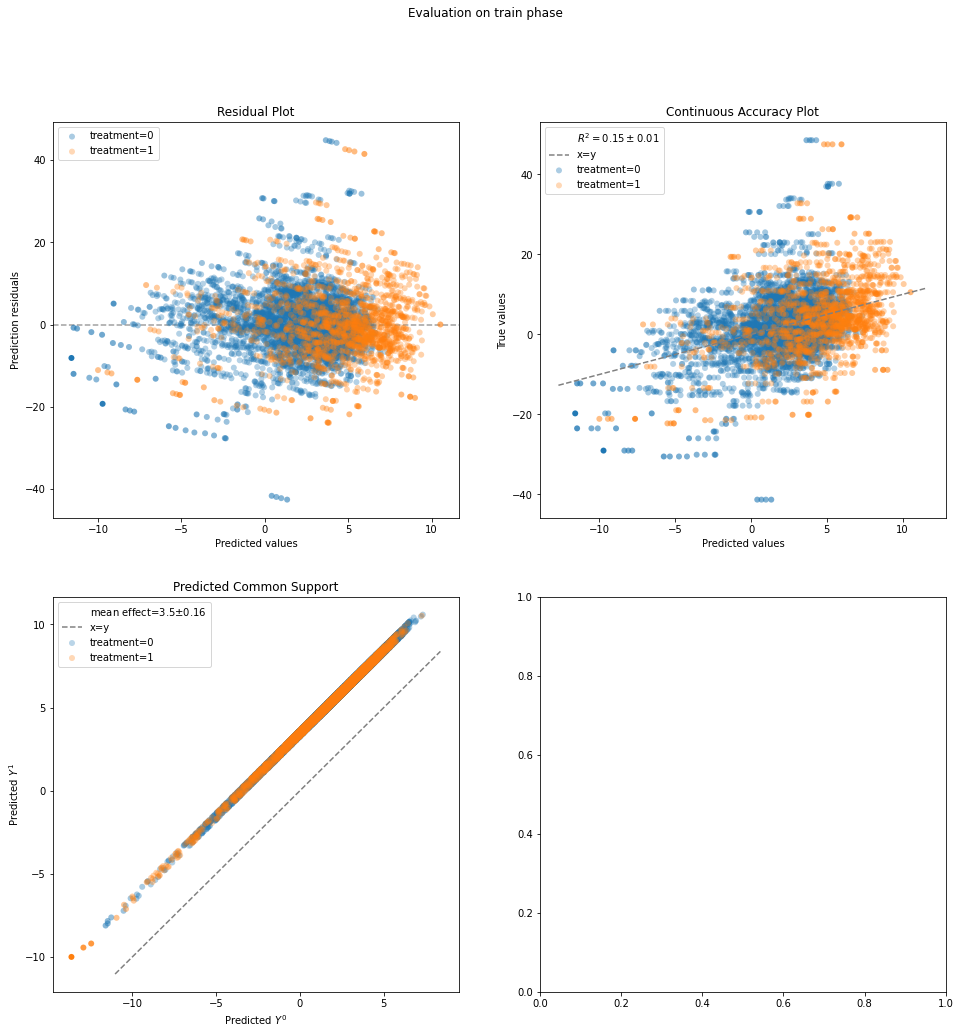
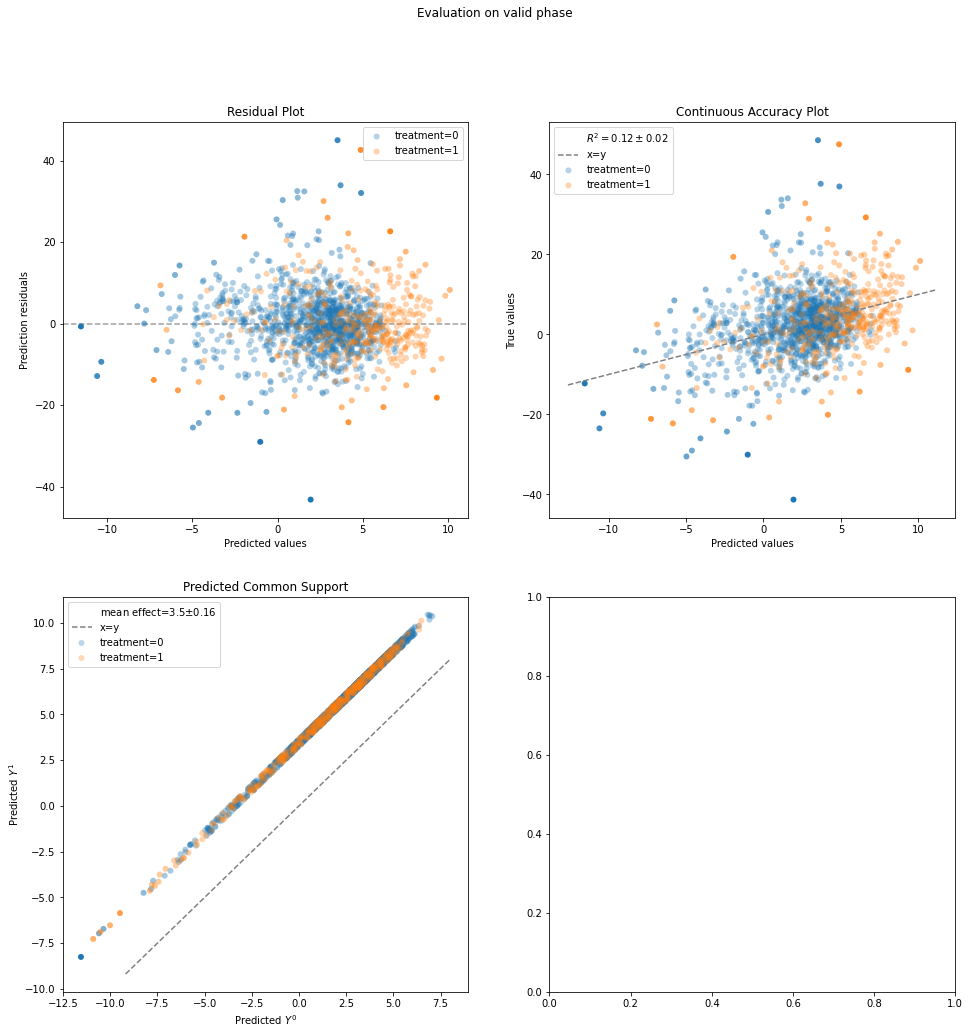
Thorough evaluation#
evaluation_results = evaluate(Standardization(LinearRegression()), data.X, data.a, data.y, cv="auto")
evaluation_results.plot_all()
{'train': {'residuals': <AxesSubplot:title={'center':'Residual Plot'}, xlabel='Predicted values', ylabel='Prediction residuals'>,
  'continuous_accuracy': <AxesSubplot:title={'center':'Continuous Accuracy Plot'}, xlabel='Predicted values', ylabel='True values'>,
  'common_support': <AxesSubplot:title={'center':'Predicted Common Support'}, xlabel='Predicted $Y^0$', ylabel='Predicted $Y^1$'>},
 'valid': {'residuals': <AxesSubplot:title={'center':'Residual Plot'}, xlabel='Predicted values', ylabel='Prediction residuals'>,
  'continuous_accuracy': <AxesSubplot:title={'center':'Continuous Accuracy Plot'}, xlabel='Predicted values', ylabel='True values'>,
  'common_support': <AxesSubplot:title={'center':'Predicted Common Support'}, xlabel='Predicted $Y^0$', ylabel='Predicted $Y^1$'>}}
results.evaluated_metrics
| expvar | mae | mse | mdae | r2 | |
|---|---|---|---|---|---|
| model_strata | |||||
| actual | 0.305271 | 4.748815 | 43.110264 | 3.725702 | 0.305271 |
| 0 | 0.134184 | 4.984365 | 48.001726 | 3.892460 | 0.134184 |
| 1 | 0.620207 | 4.069050 | 28.994209 | 3.366938 | 0.620207 |
results.models
StratifiedStandardization(learner=LinearRegression())